Heat Maps: About
Raw stuff is only half the equation (or maybe a third depending on who you ask) for great pitching. If you can locate a below average fastball in the perfect corner of the strike zone, it can become a highly effective pitch. If you have an incredible slider but hang it in the middle of the zone, it will still get crushed by batters.
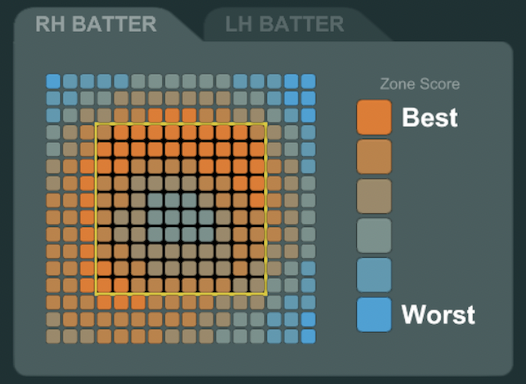
STUFFpL reports include location heat maps for each pitch type against right and left-handed batters. The orange locations in the heat map describe which locations are most beneficial to the pitcher, while blue locations are less effective. Heat maps are always shown from the pitcher’s point of view.
STUFFpL heat maps are created by the STUFFpL model and are personalized to your unique pitch characteristics.
Many pitches have multiple locations where they perform well. For example, a right-handed slider may be effective down and away from a right-handed batter, but it might also work up and inside (sometimes called a ‘backdoor’ slider). It can also be useful to see how much margin for error a particular location has. A typical sider may have much more room to perform well down and away, but it might require hitting the corner of the zone more precisely from the ‘backdoor’ location.
The heat map extends beyond the limits of the strike zone on all sides. The yellow box in the heat map represents the strike zone. Locations outside of the yellow box would be balls according to the rule book (although they may not always be called balls in game). In some cases, these locations may be effective if batters are likely to swing and miss.